
Wednesday, June 27, 2018
GIS Programming Module 6
Tuesday, June 19, 2018
GIS Programming Module 5
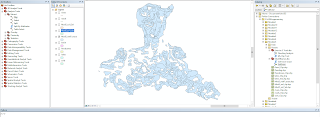
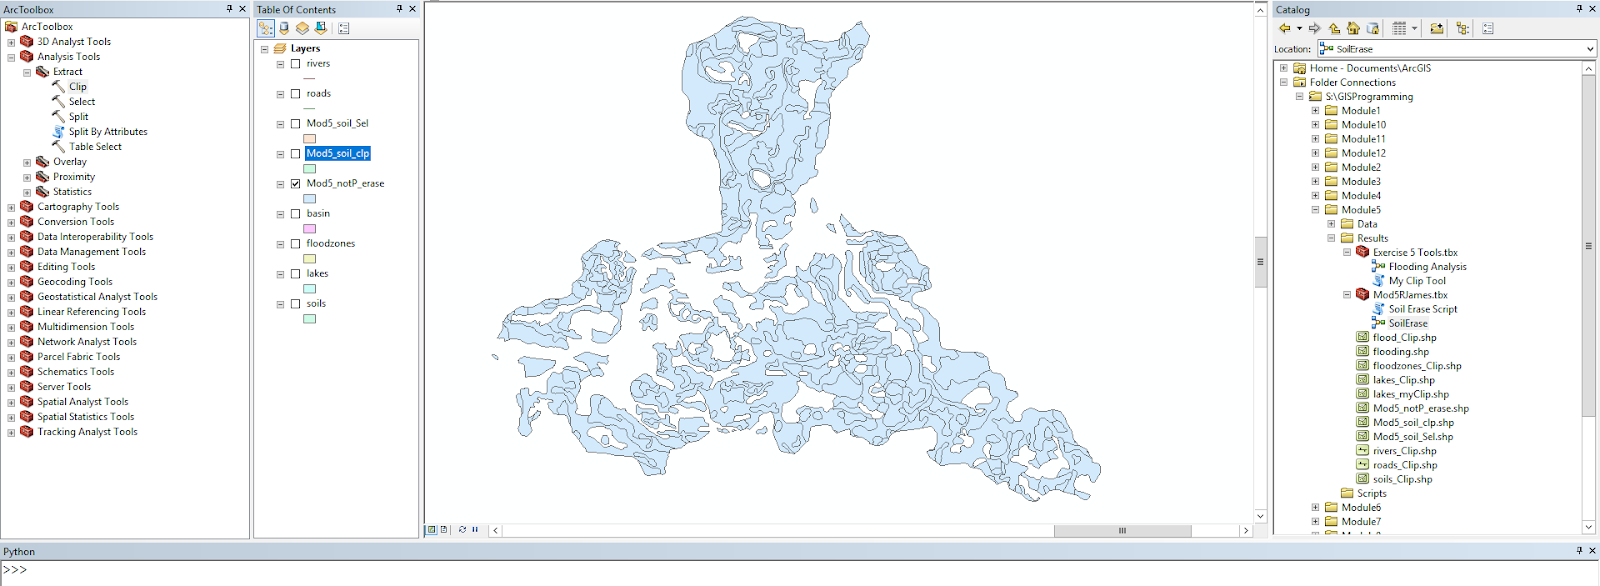
This week in the lab we worked with creating Models and running scripts in ArcMap. To create the Model I completed the following steps.
These steps resulted in the following flowchart and map results.

1.
The
first Step is to create a toolbox for the model to live in and set the
workspace environment to the results folder for the module.
2.
Then
the model is created and named appropriately
3.
For
this model the input shapefiles were added by dragging directly from the ArcGIS
table of Contents
4.
The
tools, Clip, Select, and Erase were all added by dragging them into the window
from the toolbox.
5.
Then
the connections were made by filling each tool with the required parameters or
shapefiles (inputs/outputs).
These steps resulted in the following flowchart and map results.

Wednesday, June 13, 2018
GIS Programming Peer Review 1
Link:
https://www-jstor-org.ezproxy.lib.uwf.edu/stable/42657268?Search=yes&resultItemClick=true&searchText=python&searchText=scripting&searchUri=%2Faction%2FdoBasicSearch%3FQuery%3Dpython%2Bscripting&refreqid=search%3A1ff09cdfb20ab992fb9dfb774319df52&seq=1#page_scan_tab_contents
The article I reviewed discusses the creation of a
geoprocessing tool for ArcGIS using Python that simplifies a simulation
procedure and automates the data flow between predictive models. The tool was
created based on a need for less human interaction and error when using
hydrodynamic and morphodynamic modelling of coastlines. In the study ArcGIS was
chosen due to the ability to work with and analyze raster surface models and
the scripting support provided through the Python scripting language.
The development of the tool seems to have stemmed from
need for a solution to the problem of entering data manually and converting
data between two different models. As described in the article this process
when accomplished manually would be lengthy and riddled with human errors. The
originality is shown in the BeachMM tool since it was created specifically to
work with the two separate existing models for hydrodynamics.
Rather than a research paper, the article reads like
an instruction manual for how the tool works with the two preexisting models.
There is some history present about the previous models and why the research is
taking place, but the focus of the paper is more of a how the tool was created
and for what purpose rather than a step-by-step.
There are many strengths in the article. I believe the
author clearly describes the need for the tool and how it will assist in the
analysis process. There is also plenty of background information on the two
preexisting models and how they are being used in the analysis of the coastal
erosion. Overall the article is a strong presentation of how the tool was
created and how it will be used in the analysis process.
Weaknesses of the article include the fact that the
research is separate from the topic of the article. The research being done is
on coastal erosion and the article focuses on the tool used to enhance the
analysis process. In my opinion this article should be a section or chapter of
a larger research project. There is still information on why the tool is being created,
but the larger overarching research topic is lacking in description or
background.
In the article the methods are clearly developed from
inception of the idea to examples of the tool working with the preexisting
models. The article leans toward the technical side, but provides a clear path
to follow of how the tool was developed. One thing I really enjoyed about the
article is the images of the analysis and actual desktop representations of the
tool in action. This is extremely valuable for visual learner rather than two
more pages of columned text.
The results of the development are clearly shown in
the article and the references are well cited throughout the text and in the
acknowledgements section. The article scores high in quality and quantity in my
opinion seeing that it is only about nine pages and could realistically fill a
chapter in the Esri ArcGIS manual for the tool with more explanation. The
readability of the article ranked slightly lower in my opinion due to the
highly technical nature of the topic. I understand that this class and topic
are technical to begin with, but someone with no experience in GIS or coding
would have a very hard time in deciphering some of the processes and steps of
development.
References:
GIS Programming Module 4
In part one the script debugging gave me a lot of fits due to the small errors that I am not use to catching yet. Once I realized what they were the rest of the script debugging went pretty smooth.


Tuesday, June 5, 2018
GIS Programming Module 3
This week in the lab we focused on error management and creating code from scratch. Below is my output and scripting to reach the goal of the lab.
 To
remove the numbers from the list that were equal to the “bad” number that was
randomly generated I had to set a variable for how many bad numbers there were
in the list. I
then used a while loop when bad was greater than zero to remove one iteration
of the number from the list and decrease the value of bad by one. This
continued until bad equaled zero therefore removing all bad numbers from the
list.
To
remove the numbers from the list that were equal to the “bad” number that was
randomly generated I had to set a variable for how many bad numbers there were
in the list. I
then used a while loop when bad was greater than zero to remove one iteration
of the number from the list and decrease the value of bad by one. This
continued until bad equaled zero therefore removing all bad numbers from the
list.

Subscribe to:
Posts (Atom)