For this video the screenshots show how at different times in the video the data displayed is different and the symbology and labels correspond to the time frame being displayed. These features are accomplished through dynamic and static labeling along with corresponding displayed symbology.
 |
| Year 1870 |
 |
| Year 1970 |
In the first image you can see the year label 1870 is darkened to represent the current data year. The symbology also reflects the graduated symbol population of the major U.S. cities for the year of 1870. Also at the top right of the map you can see we practiced adding the dynamic text with the "Year: 1870" displayed. In the second image you can see that the data is different based on the symbology for the population and the dynamic labels representing the year 1970 rather than 1870. These images are just two screenshots from the video file. When the video is played it shows the years of data in a chronological order and the populations seem to grow as the years progress. It is a very fancy representation of a large amount of trend data.
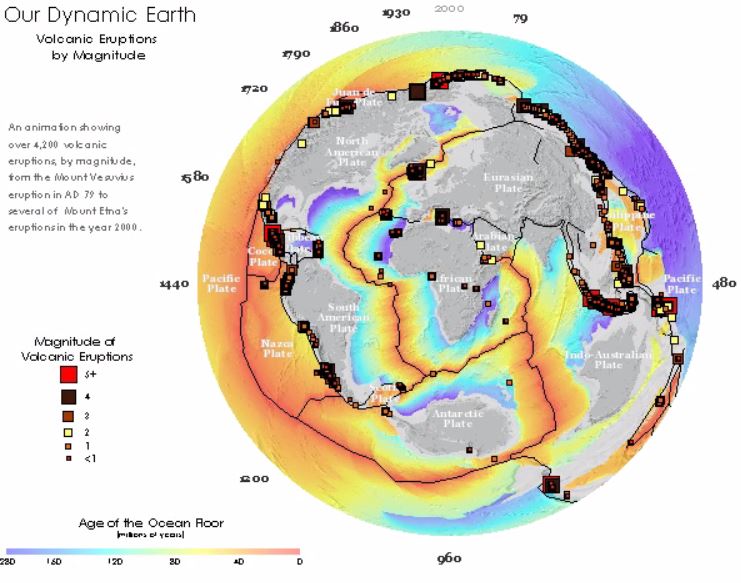
The second video map for the lab worked in the same way except the layout was slightly different. In the screenshots you can see the labels are in different locations representing a part of the whole data rather than a snapshot year. The data builds rather than changing. In this map the number and locations of volcanic eruptions is mapped with the year and magnitude of each.

In these images you can see the building data along with the representation of the years passed going around the globe. Again another inventive idea to represent compiling data in order to analyse trends.
No comments:
Post a Comment